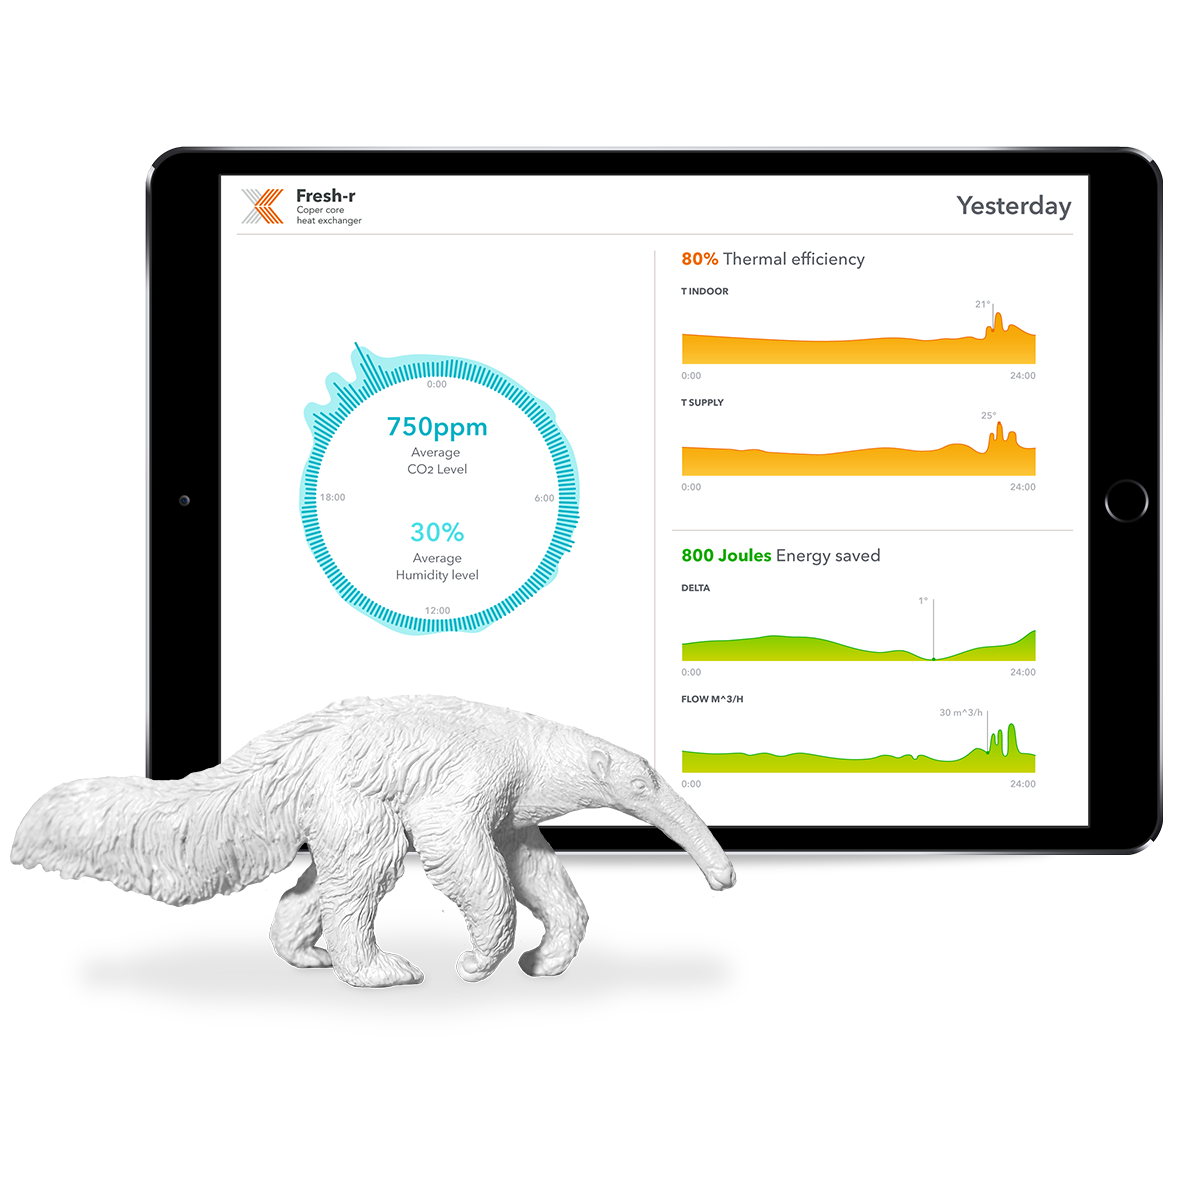
Fresh-r is an air purifier that continuously measures CO2, particulate matter, and air humidity, and ventilating when necessary. We worked with Vaventis to design a visualization that shows the benefits of the product and that brings meaning to the data.
We started by getting a thorough understanding of the product and its context.
While best practices are still emerging, the Smart Home is hardly new. We began by looking at best-in-class experiences and developing some provocations. For example, should the product feel more about fitting into the home or more about the data being displayed?
We broke the data apart to develop a better understanding of what needed visualizing.
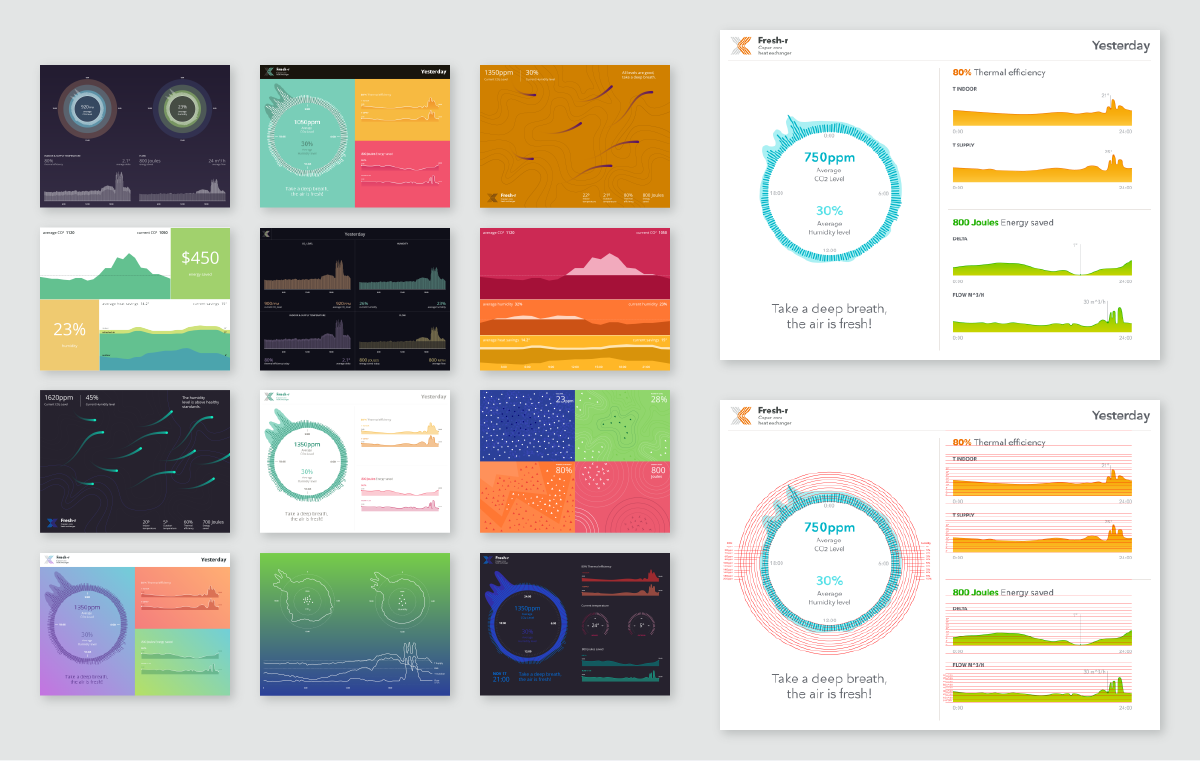
Not all data should be visualized in the same way. We assessed each individual type of data to find the most effective combinations and visualizations for each.
We optimized the design using real data.
We built a prototype using D3 so that we could generate visualizations from actual data. From this, we were able to tweak visualization rules and recommend smoothing formulas for the most meaningful output.
Team
one designer, creative director, tech director
Role
creative director
Years
2016